Arizona Residential Real Estate Market Report – January 2016
This is a snapshot of four different areas of the Arizona real estate market for January 2016. For more about how these segments are divided, please see the note at the end of this article.
| Quick Takeaways – Real Estate Across Arizona January saw lower sales than December, most likely due to seasonal factors. The ups and downs of the last ten years make prediction risky, but pending sales are significantly higher, which I believe signals the start of the traditional second quarter surge in business. An upward trend in new listings will provide potential buyers with more choices throughout the state. Average prices throughout Arizona continue to fluctuate from month to month, with a general upward trend. |
 |
Sales Lower in January
Across Arizona, January sales were off 20%-30% from December 2015. However, January closings arise from November and December contracts, which typically slow down over the Holidays. Compared with a year ago, sales are up nearly 10%, reflecting experts’ predictions of a stronger year for 2016. The chart below indicates that January sales in progress were 40% higher than December, with the Southeast area leading the way at 70%! The Metro Phoenix area (Urban Desert) matches the statewide growth with Northern Highlands and River Country also indicating stronger markets.
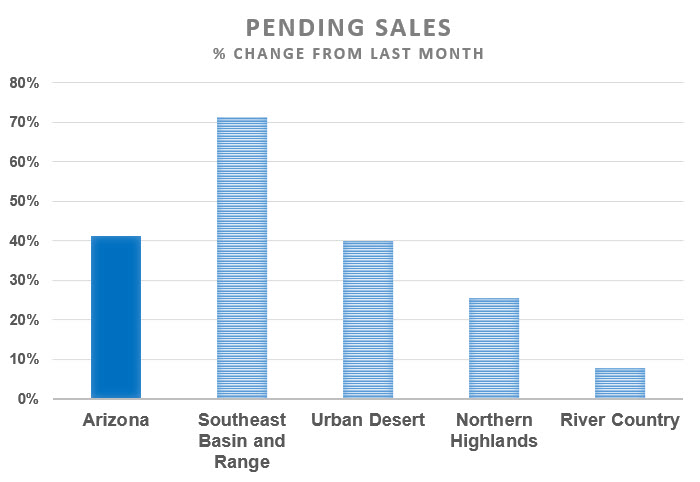 Chart 1
Inventories Lower Than a Year Ago, But Growing
Statewide active listings are down 20% from a year ago, so if demand strengthens, a shortage of inventory could push prices higher. Our highest area in sales (Urban Desert) has been experiencing a moderate seller’s market for nearly a year due largely to a dip in active listings. Arizona inventory seems to be slightly higher in January 2016, except in the Northern Highlands (see Chart 2).
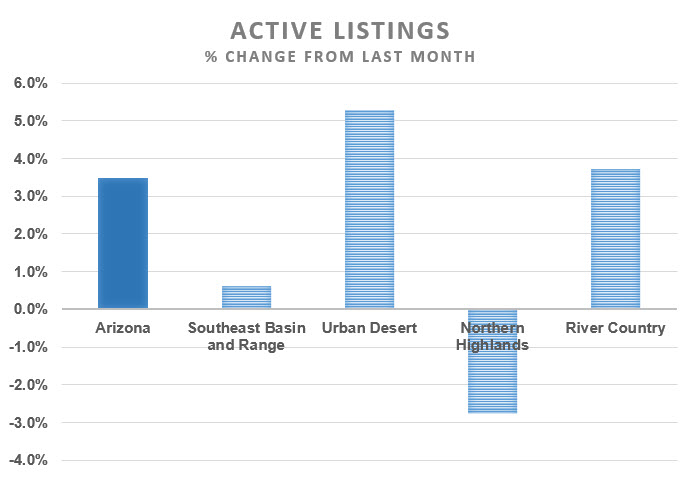 Chart 2
These increases in inventory are being fueled by an influx of new listings of homes across all markets (that’s new listings, not newly-built homes being listed). As Chart 3 indicates below, the smallest increase in new listings is over 20% (River Country), while the largest is found in the Urban Desert at nearly 70%, representing nearly 4,000 homes listed in January alone.
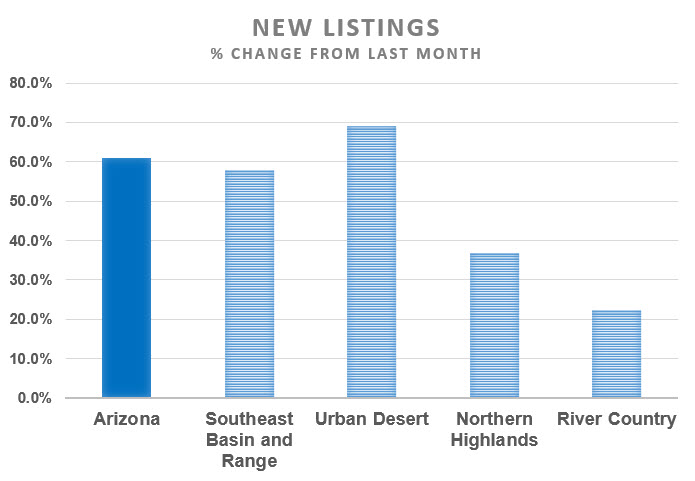 Chart 3
Prices Rising Slowly
Along with REALTORS®, consumers also watch our final statistic, which is Price: What is my home worth? How much will I have to pay for my dream house? It’s important to note that these average sales prices are often affected by factors unrelated to supply and demand, such as weather conditions or which price ranges are selling. This is particularly true when considering an area as large and diverse as the state of Arizona. That said, we can make some general observations about home prices.
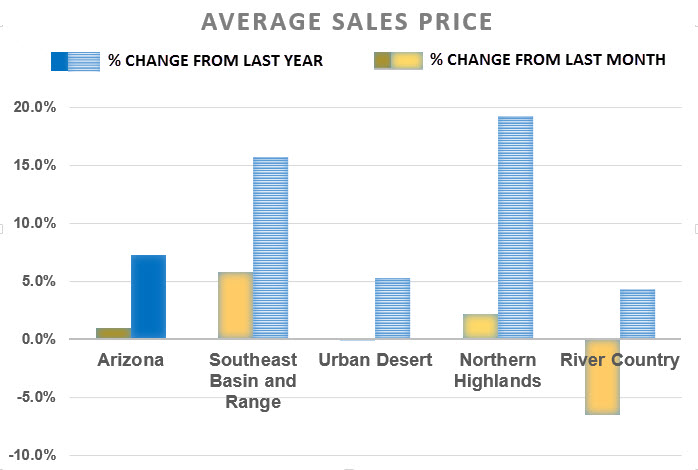 Chart 4
As Chart 4 shows, average prices in Arizona are up only slightly from last month. The biggest increase (over 5%) occurred in the Tucson/Southeast area, with the northern part of the state posting a small increase. On the other hand, both the Urban Desert and River Country areas saw average prices drop month-over-month. However, the year-over-year picture is much more positive. Statewide average prices increased over 7% from a year ago. In fact, prices increased across all areas with the Northern leading the way at 19%, Southeast Arizona at 16% and prices increasing in the Urban Desert and River Country areas at around 5%.
Notes
These statistics are sourced from the REALTOR® Property Resource (RPR), which draws them directly from MLS systems across Arizona. In some cases, statistics are reported differently by local MLSs, which may occasionally result in dissimilar figures.
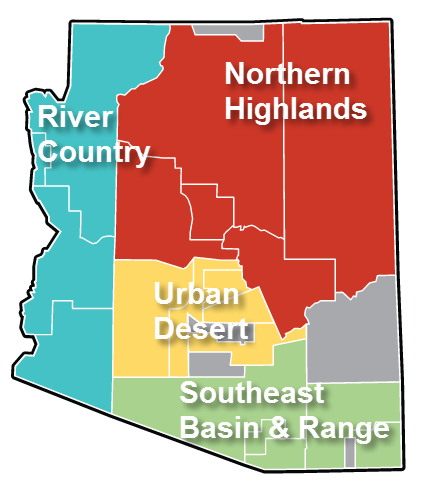
For discussion purposes, the state of Arizona is divided into four distinct areas. Although it is the smallest area geographically, Urban Desert represents about 73% of the properties sold in Arizona and consists primarily of Maricopa County and part of Pinal County. Southeast Basin and Range makes up approximately 15% of the statewide market and represents Tucson and the counties south and east of it. The two smallest areas (around 5-7% each) are Northern Highlands including Flagstaff, Prescott, Sedona Payson and White Mountains, and River Country — which includes Kingman and our river cities of Bullhead City, Lake Havasu City and Yuma. While we could chose areas many different ways, these groupings work well in terms of climate, economy and terrain.
Tags: active listings, average sales price, market report, new listings, Northern Highlands, pending sales, REALTOR® Property Resource, River Country, RPR, Southeast Basin and Range, Urban Desert