Arizona Residential Real Estate Market Report – February 2016
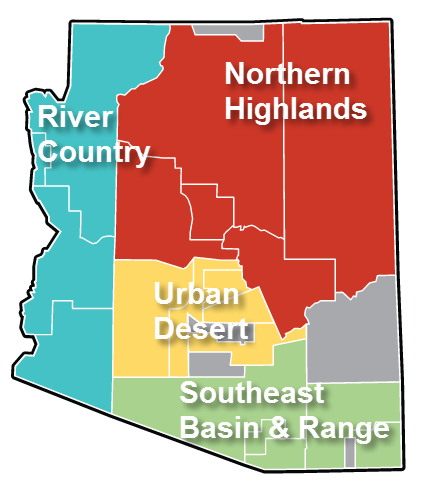
This is a snapshot of four different regions of the Arizona real estate market for February 2016. For more information about how these segments are divided, please see the note at the end of this article.
Quick Takeaways – Real Estate Across Arizona
February sales were markedly higher than January’s across the entire state. Inventories were slightly lower, but continued strong supplies of new listings provide buyers with plenty of choices. Prices continue to be higher than a year ago and a mild “seller’s market” continues throughout most regions. High numbers of Pending Sales in February suggest March will also be another good month.
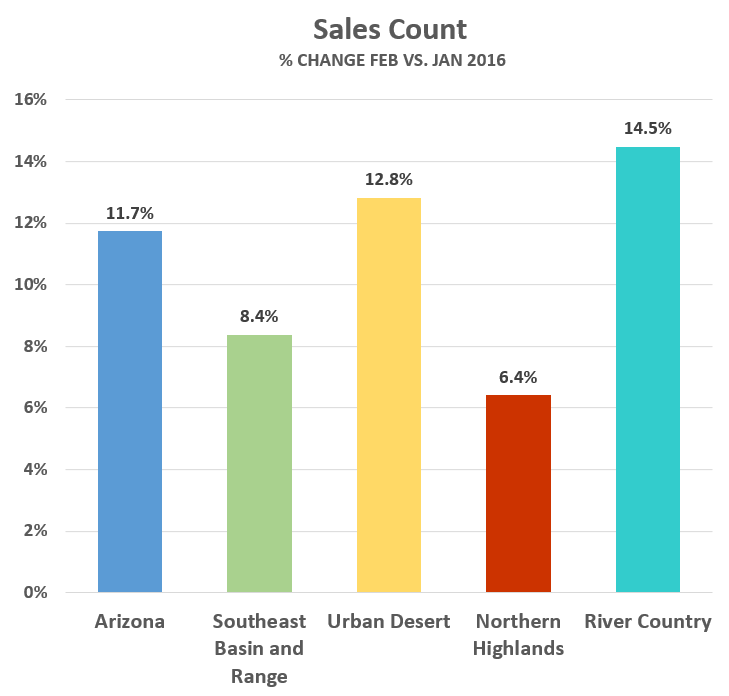
Sales Up 12% in February, Continued Strong Pending Sales
Sales surged 11.7% in Arizona, with increases ranging from 6.4% in the Northern Highlands to 14.5% in River Country (Chart 1). Our Urban Desert region (the state’s busiest market real estate market) showed a strong 12.8% increase.
Pending Sales were active again in February, up 45.5% statewide. The Southeast Basin and Range again leads the way with all areas showing an increase over January.
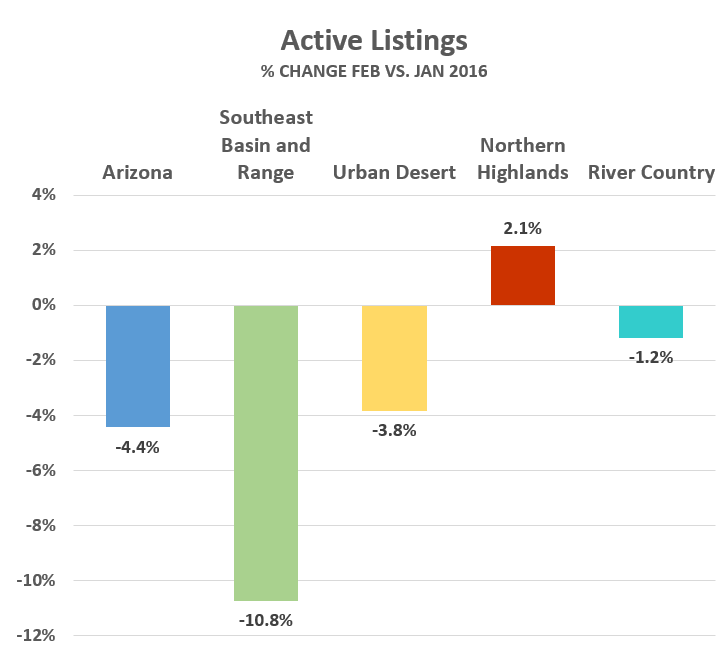
Inventories Slightly Lower, New Listings Continue Strong
The spring buying season in Arizona is in full swing, with inventories receding even further. Active Listings (properties available for purchase) have dropped by a little more than 4% from last month and 18% from a year ago (Chart 2).
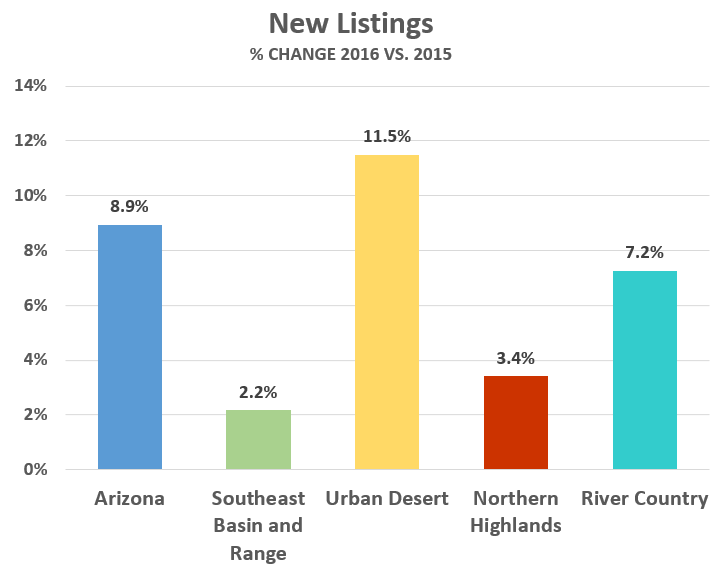
Although overall inventories are lower, the influx of New Listings (Chart 3) is keeping things interesting. Across the state, New Listings have dropped by nearly 2%, but it is important to remember that these listings are in addition to last month’s new listings. To put this in perspective, more than 30,000 New Listings have been added to the statewide pool in the first two months of this year which is a slightly higher rate than the last three years.
Despite the decrease in Active Listings (Chart 2 above), the seller’s market in the large Urban Desert (which is responsible for nearly three-quarters of all sales in the state) is continuing to ease. Clearly seller’s or buyer’s markets are combinations of factors, not just inventory. Increases in sales, pending sales, new listings and average prices still make markets favorable to sellers; however, if Active Listings continue to decline, the seller’s market may strengthen.
Prices Continue to Increase
Obviously, if you are a seller you’d like to see prices increasing. Average sales prices in Arizona are flat from last month, but moderately higher than a year ago (Chart 4). Year-over-year average price increases of 6.5% indicate healthy real estate markets.
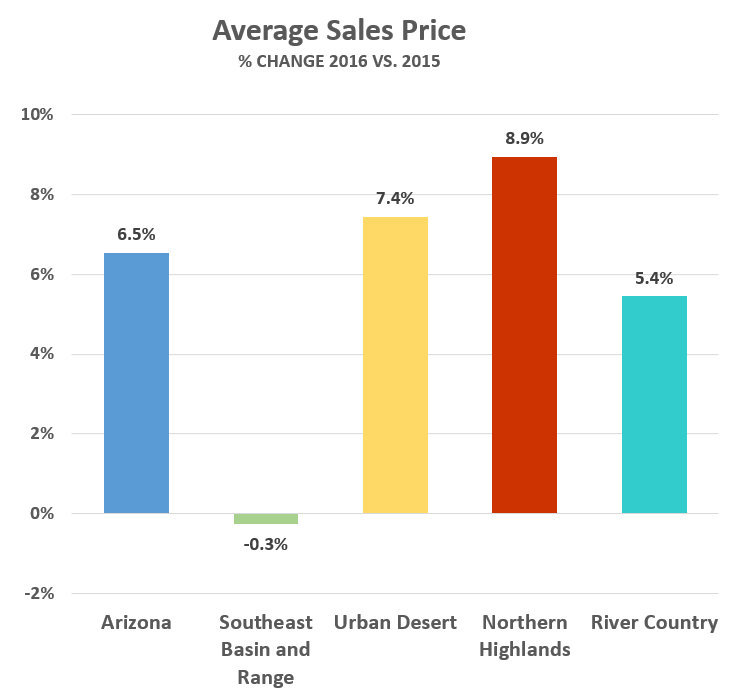
It is interesting to note that the only region in Arizona not showing this sort of price growth over the past year is the Southeast Basin and Range, where prices are essentially flat. This area is dominated by the Tucson market which has been experiencing large year-over-year sales increases from 2015. This tends to flatten average sales price.
Notes
These statistics are sourced from the REALTOR® Property Resource (RPR), which draws them directly from MLS systems across Arizona. In some cases, RPR reports its statistics differently from MLSs, which may occasionally result in dissimilar figures. For discussion purposes, the state of Arizona is divided into four distinct regions below. While we could chose regions many different ways, these groupings work well in terms of climate, economies and terrain.
| Urban Desert | Maricopa and western Pinal counties | |
| Southeast Basin and Range | Tucson and counties south and east of Pima | |
| Northern Highlands | Flagstaff, Prescott, Sedona, Payson and White Mountains | |
| River Country | Kingman, Bullhead City, Lake Havasu City and Yuma |