Arizona Residential Real Estate Market Report – March 2016
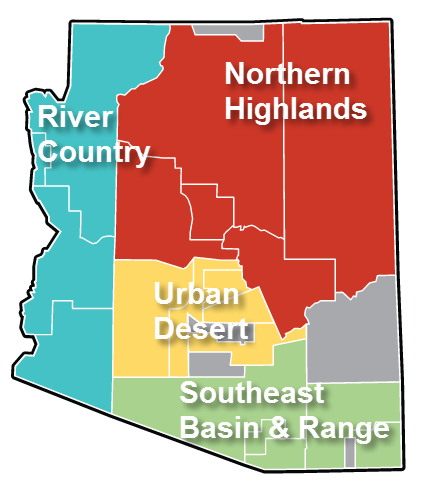
This is a snapshot of four different regions of the Arizona real estate market for March 2016. For more about how these segments are divided, please see the note at the end of this article.
Quick Takeaways – Real Estate Across Arizona
March sales were very strong, significantly higher than February’s healthy market. The Urban Desert region has the highest month-over-month sales growth, slightly higher than that of the Southeast Basin and Range. Active Listing are down, which is creating seller’s market conditions across the entire state.
The Northern Highlands is the only region experiencing an increase in Active Listings this month. Median home prices are up 2.5% statewide. The highest increase in median price comes from the Southeast Basin and Range, which also shows the largest decrease in Active Listings.
Sales Surge Again in March, Pending Sales Predict a Strong April
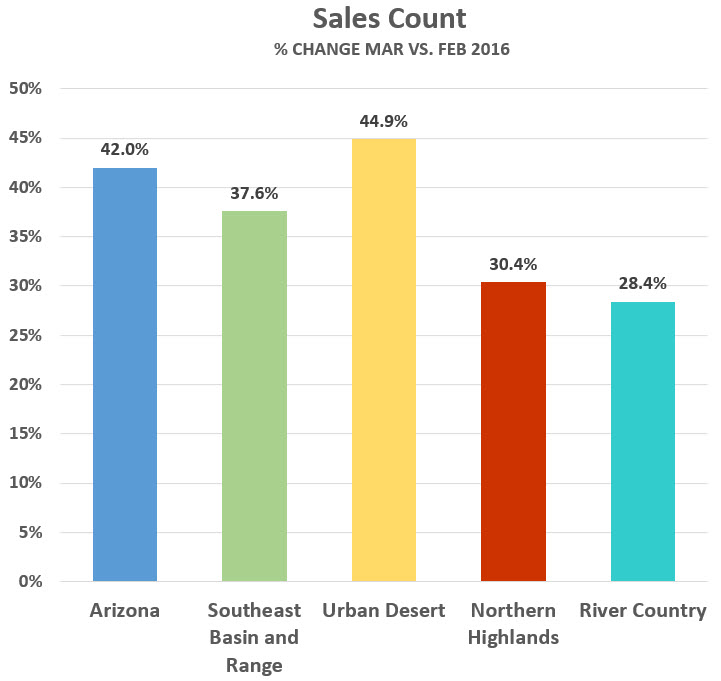
Sales are up 42% statewide, following February’s 12% increase (Chart 1). February’s strong sales are multiplied two to four times in every region this month. Once again, the Urban Desert region (the state’s busiest market real estate market) led the way with a 45% increase from February to March.
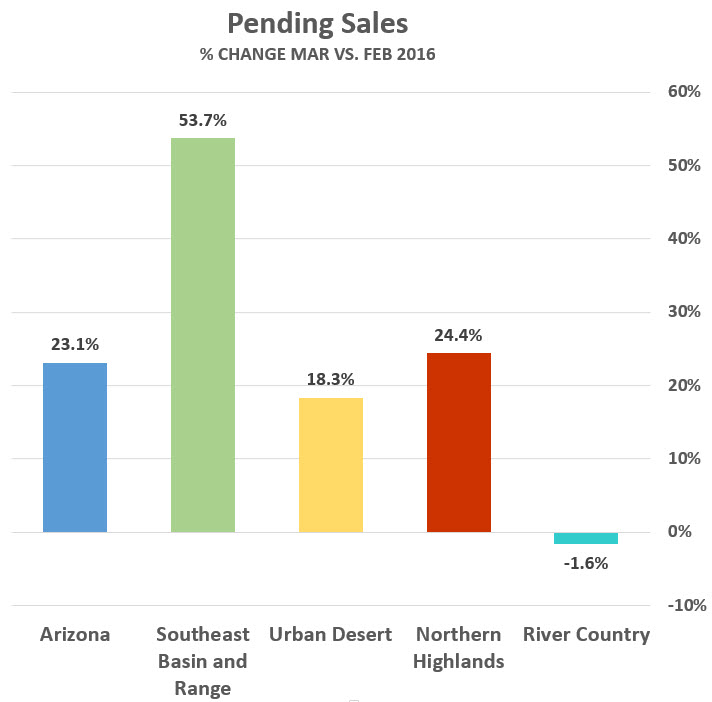
Pending Sales, a leading indicator for sales in successive months, were up again in March (Chart 2) predicting strong sales in April as well. Moving into Q2 of 2016, we have a much more active Arizona housing market than last year. Generally, Q2 is the strongest quarter of the year, followed by Q3. The question is whether this robust activity closing out Q1 is an early market peak or if it will extend into Q2 and Q3 for a truly exceptional year.
Before moving on to our Supply discussion, have a look at Chart 3, which is a line graph depicting the previous four month’s relationships among units sold, pending sales and active listings.
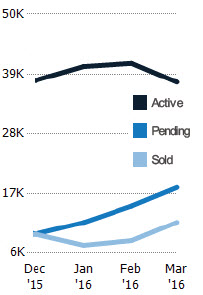
As you can see, Sales slowed in January (light blue line), but are trending higher. Pending sales (dark blue line) have been rising rapidly each month, predicting higher sales for the following month. However, the high volume of homes under contract are depleting the available inventory of Active listings (dark black line), creating a seller’s market in most regions.
Inventories Lower, New Listings Not Keeping Pace
Inventories across Arizona decreased another 8.5%, following February’s 4.4% drop (Chart 4). The Northern Highlands was the only region to see inventory actually increase despite two months of excellent sales growth.
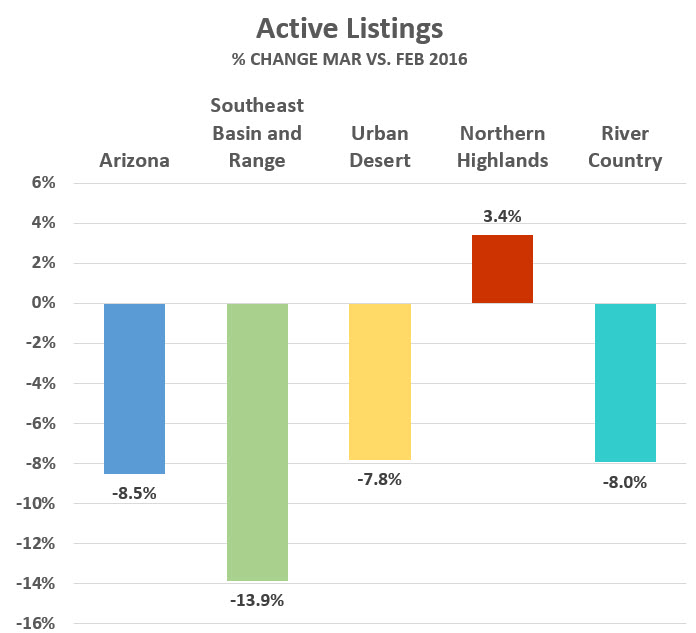
New listings added to the inventory are the only counterbalance to the strong sales we’ve been seeing and they are not keeping pace. Clearly, we are seeing seller’s market conditions across Arizona. Although new listings continue to enter inventory at a higher rate than last year, they are down nearly 2% from February to March.
It’s interesting that while new listings are slowing overall, this effect is seen only in the two larger markets, Urban Desert (Phoenix area) and Southeast Basin and Range (Tucson area). New listings continue to grow in the Northern Highlands and River Country. Climate can’t account for this, as the Northern Highlands is our coolest region while River Country is our warmest.
Prices Continue to Increase
Median home prices rose slightly in March, increasing a modest 2.5% from February (Chart 5), with the exception of the Northern Highlands which is essentially flat. This increase in prices is to be expected in our broadening seller’s market. Statewide, median prices are higher just over 7% year-over-year.
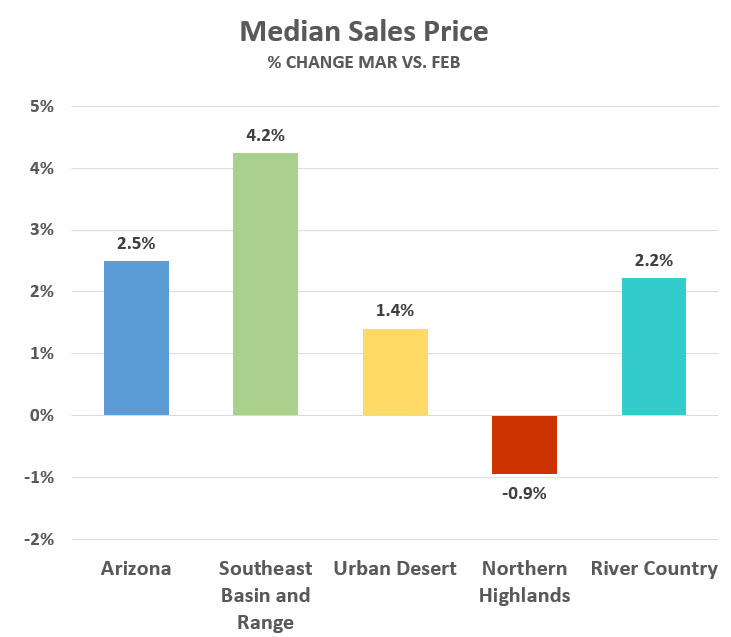
To explain the Northern Highlands’ apparently anomaly of slightly lower prices in a seller’s market, it’s useful to compare their median price ($210k) to their average price ($245k). This difference suggests that greater numbers of homes in lower price ranges are being sold than in higher price ranges, which artificially lowers overall prices.
As we’ve discussed before, you get the most accurate pricing information in any market by looking at narrow price ranges which requires the services of a knowledgeable professional. REALTORS® are always the best source of information in any market!
Note
These statistics are sourced from the REALTOR® Property Resource (RPR), which draws them directly from MLS systems across Arizona. In some cases, RPR reports its statistics differently from MLSs, which may occasionally result in dissimilar figures. For discussion purposes, the state of Arizona is divided into four distinct regions. While we could chose regions many different ways, these groupings work well in terms of climate, economies and terrain.
| Urban Desert | Maricopa and western Pinal counties | |
| Southeast Basin and Range | Tucson and counties south and east of Pima | |
| Northern Highlands | Flagstaff, Prescott, Sedona, Payson and White Mountains | |
| River Country | Kingman, Bullhead City, Lake Havasu City and Yuma |