State of the Nation’s Housing 2017
Abridged presentation by Dr. Chris Herbert, Joint Center for Housing Studies, Harvard University
at the National Assn. of Real Estate Editors 2017 Conference in Denver, Colo.
Our mission as a center is quite simple…to raise understanding of housing issues and to inform policy. One of the primary ways we do that is through our signature report, The State of the Nation’s Housing Report.
We’re seeing the housing market coming back to normal. Even though nationally prices are back to their peak…in 32 markets, prices are still more than 15% below their peak. The story on the housing market’s recovery depends on where you are in the country.
One issue we have is at the peak, we had a housing bubble. So, the peak price isn’t necessarily the price that we want to hold as a benchmark. One thing we did this year is we looked at housing prices relative to 2000, and we took into account inflation, and we said, “How have house prices changed over that longer period of time when we count that boom and bust, and where are we today?”
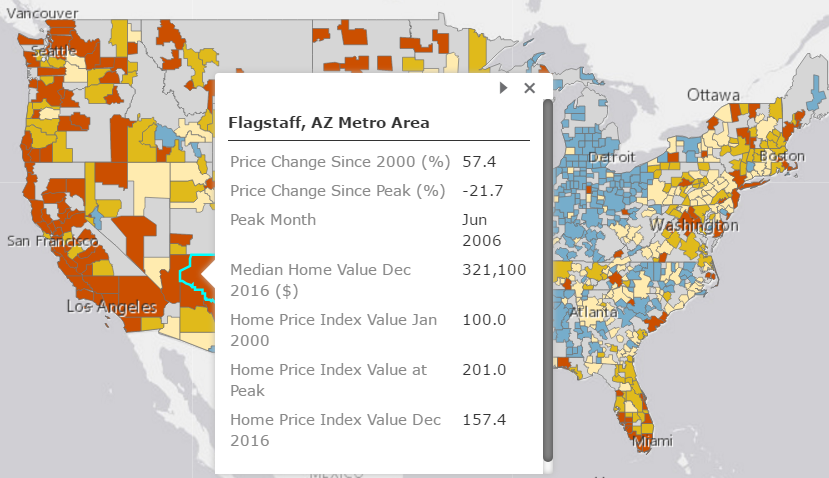 Four Arizona Metro Areas were up more than 40-percent since 2000, but still below Peak. See your Metro Area here.
Red areas have seen prices up by more than 40% in real terms since 2000. One reason why we’re seeing these house prices go up so sharply is that fact that we have housing inventory that’s incredibly tight.
Rents being unaffordable doesn’t help people save for home ownership. Student debt is an issue. Another issue is affordability. We look at the share of total households and rental households who could afford the median-priced home in the market, based on some assumptions about 5% down and a 36% to income ratio. You find that in a typical market in this country 45% of renters can afford to buy.
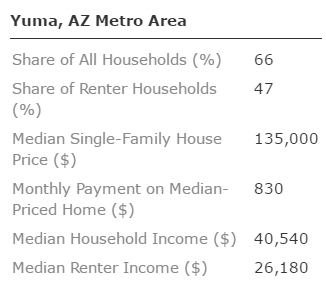
Yuma has the most affordable median-priced homes in Arizona. See your Metro Area here.
The last point is just aging. This chart shows the growth in households by different age bands. Just look at the right-hand side of that chart. Households over the age of 80 are going to go from about eight million to 16 million over the next 20 years. By 2035, one out of every three households in this country is going to be 65 and older, one out of every three. That’s a mind blowing demographic.
Aging is going to be a huge issue for the housing market going forward.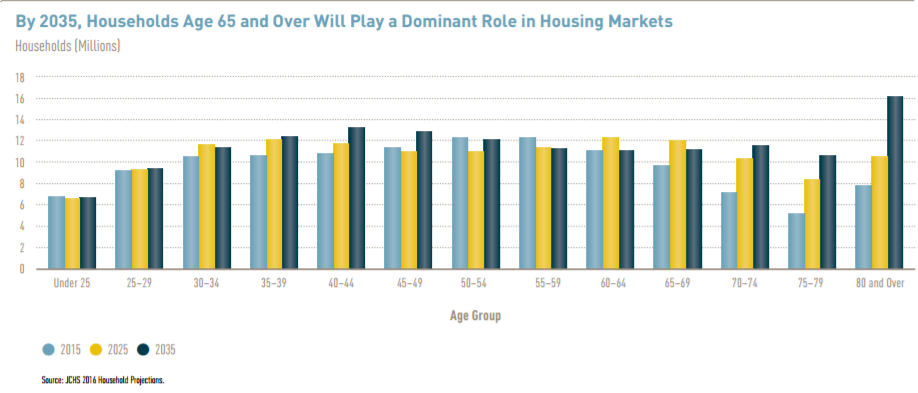
Related Fact Sheet: www.jchs.harvard.edu/sites/jchs.harvard.edu/files/harvard_jchs_son_2017_fact_sheet.pdf
Tags: Dr. Chris Herbert, State of the Nation’s Housing Report