The Valley Real Estate Market: Everything is Relative, Part 2 – Demand
Note: This article was updated 8/20/2014 with revised text and figures.
Supply alone does not tell us much about the market, since it focuses on sellers’ stories. Next, we’ll look for buyers’ stories in the demand side. Some statistical indicators of demand in STAT are Monthly Sales and Average Days on Market. Previously, we looked at Months’ Supply of Inventory (MSI), which also has a demand component.
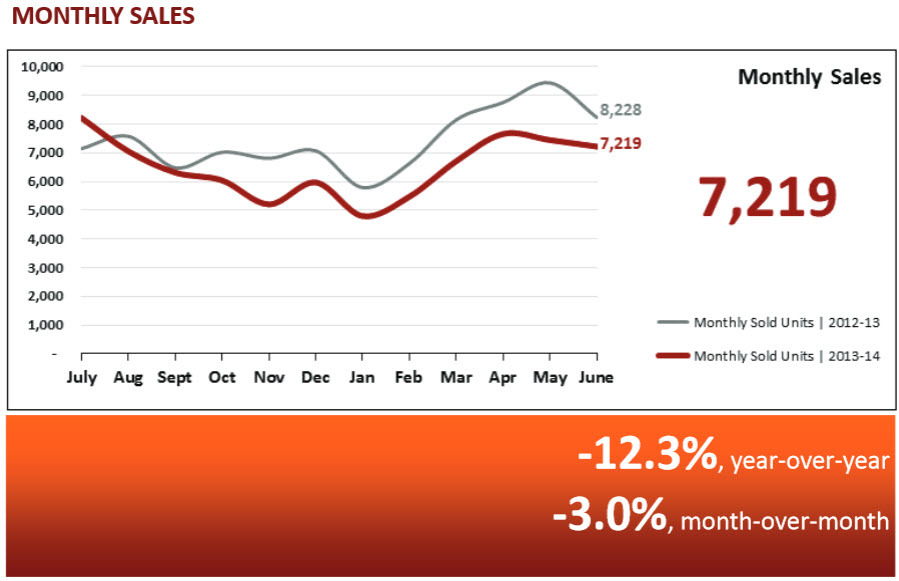
In June, Monthly Sales follows a typical summer slowing trend at another 3% lower than the previous month. After last month’s 21% year-over-year decrease, sales are down again 12% from the same period last year. We now begin to suspect that demand is lower than last year.
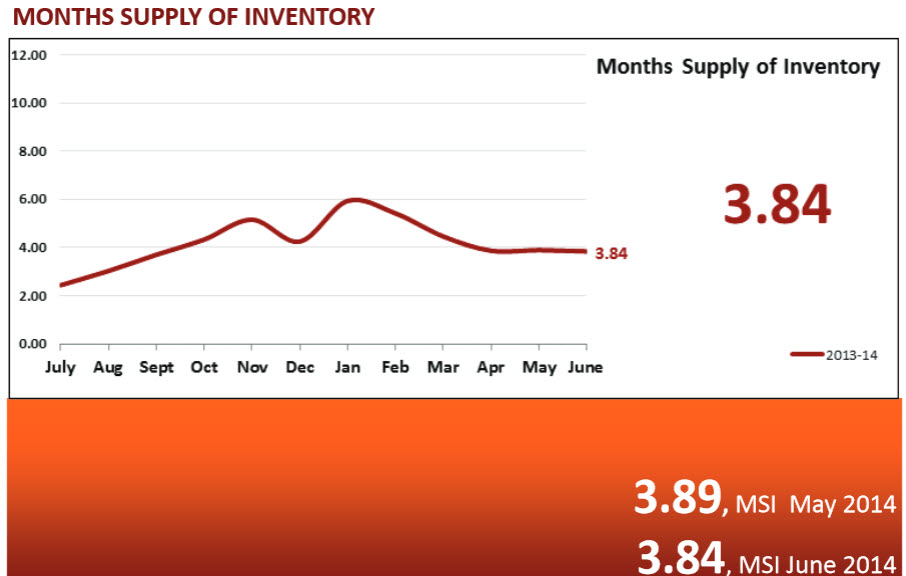
Looking again at Months’ Supply of Inventory (MSI): remember that it is a ratio of the overall inventory over the current monthly rate of sales. Since June’s MSI is higher than the long-term average, we have to wonder if the higher supply accounts for the difference. With overall inventory at historical averages and new listings coming in at numbers similar to last year’s, it is looking more and more like lower demand is impacting Monthly Sales figures and MSI.
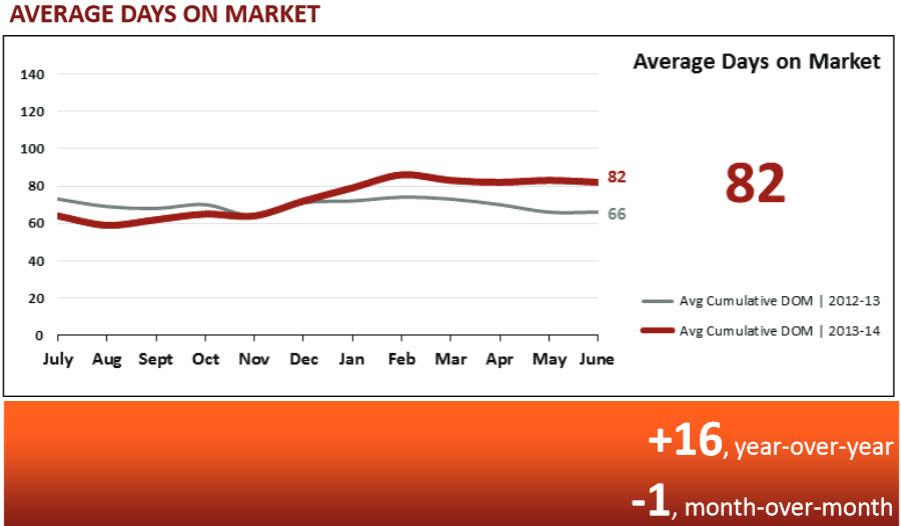
Average Days on Market (DOM) is the length of time from listing to close for the month’s sales. While actually a day lower in June than May, it is still taking 17 days (or 25%) longer to close in 2014 than in 2013. Why? Let’s look for “stories.” One explanation is that REALTORS® must market properties for two to three weeks longer to find a buyer, which hints at lower demand.
But wait… could the longer time on market for 2014 sales be explained by transactions being more complicated, making the process take longer? Where could we look for more information? Perhaps it is Distressed Sales.
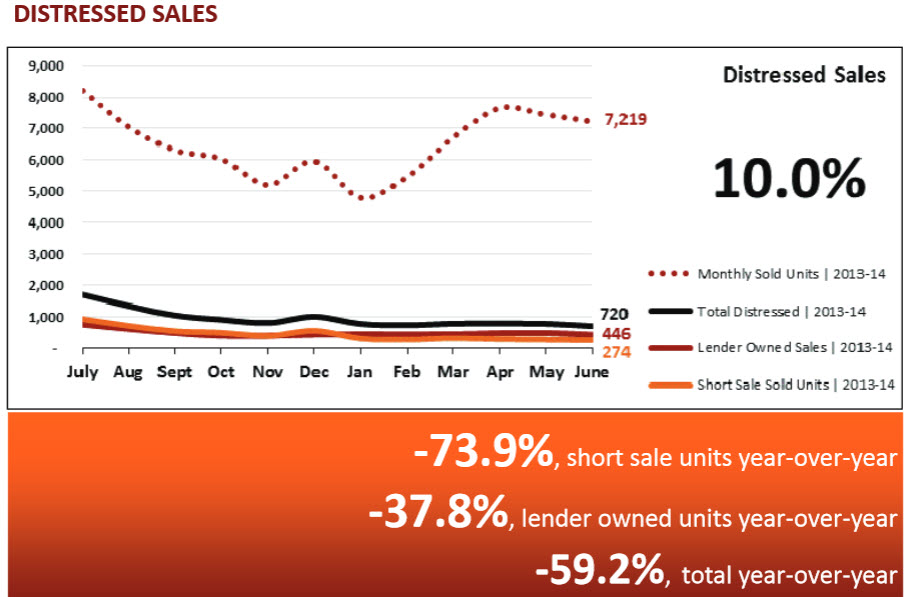
We have heard that banks and agents are working together more smoothly now, but distressed sales still tend to require more time. However, we see that Distressed Sales are 59% lower than last year and probably aren’t a factor. Lower demand still looks like the best explanation for all these figures.
Let’s do a quick recap: sales are lower year-over-year, inventory is moving at a slower pace and there doesn’t seem to be any other good explanation why Days on Market should be higher than last year. Everything points to lower demand. Here are some comments you might convey to your clients about demand in this market:
• Demand is lower than historical levels expected in a balanced market. With good inventory, buyers seem to have an advantage. Some clues to the extent of that advantage could be revealed when we look at Sales Prices and ARMLS’s Sales Price Forecast. If we see stable (flat) selling prices that would indicate that sellers aren’t overly concerned about demand and are holding out for their asking prices.
• Lower demand means individual buyers face less competition for any given property, but that does not mean that desirable homes won’t get multiple offers and move quickly. As we’ll see, buyers don’t enjoy enough advantage to play lowball games with sellers.
• That said, sellers need to know that buyers have an edge in the current market, so unless they are willing to sit on their properties, they need to price correctly.
Tags: market analysis