Arizona Residential Real Estate Market Report – August 2016
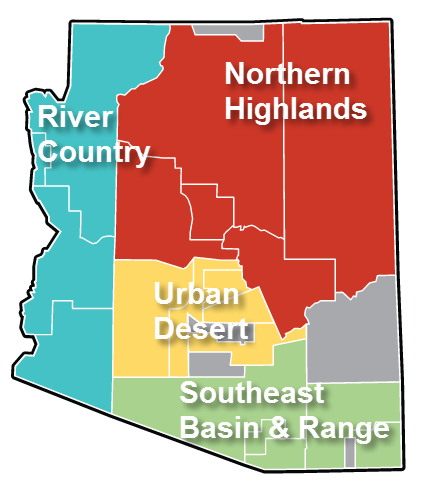
This is a snapshot of four different regions of the Arizona real estate market for August 2016. For more about how these segments are divided, please see the note at the end of this article.
Quick Takeaways – Real Estate Across Arizona
- Sales rebounded from July; large numbers of sales are in the pipeline, so the anticipated seasonal market slowdown is not in sight
- Inventories are lower and the seller’s market is getting a little stronger
- Median home prices are slightly ahead of last month; see a new metric for home values this month*
- Trends remain the same for the Arizona residential real estate market.
Sales Bouncing Back
It’s looking like an “Endless Summer” for Arizona residential real estate. In July, a seasonal drop-off in sales seemed to have finally showed up, but we cautioned that it could be attributed to July’s reduced number of business days. August’s rebound appears to bear that out (Chart 1).
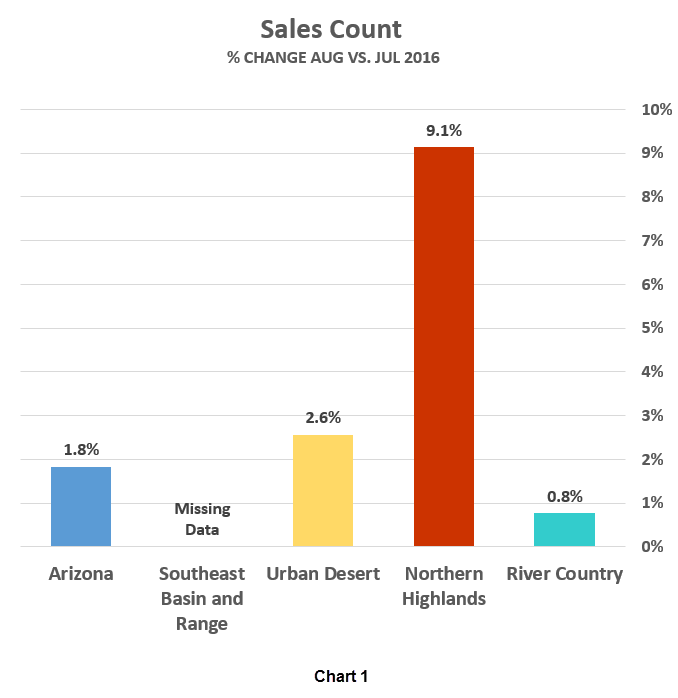
The Northern Highlands are a cool place to live, but the market has been hot all summer. Sales Count was up slightly in other areas of the state. Sales Count for the Southeast Basin and Range region is not provided, due to missing data at RPR from one of the region’s MLSs. However, MLSSAZ, the dominant MLS in southeast Arizona, is reporting a slight decrease in sales.
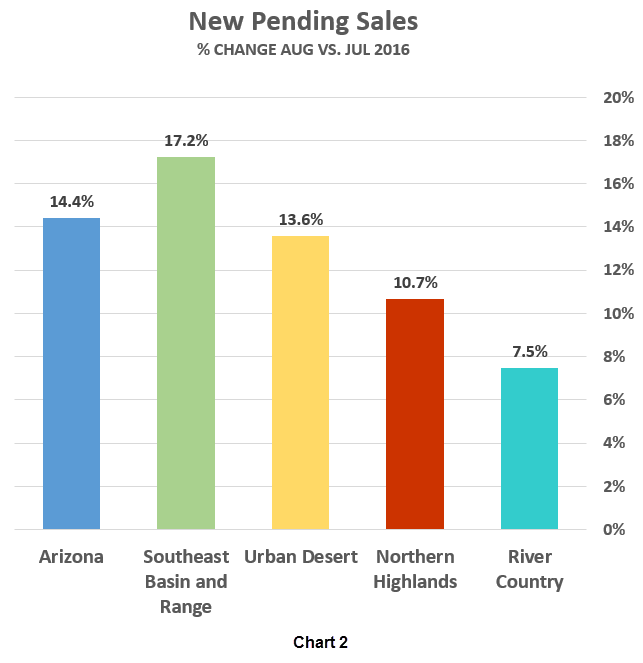
While these figures appear to extend the summer selling season, we should mention that the same calendar-driven effects that resulted in July having two fewer business days gave August two additional business days—more business days means more business. But the summer market isn’t over yet, as New Pending Sales (Chart 2) have increased across Arizona, predicting a great September report. It’s interesting to note that New Pending Sales are up 41-percent over August of last year.
Inventories Lower — An Even Stronger Seller’s Market
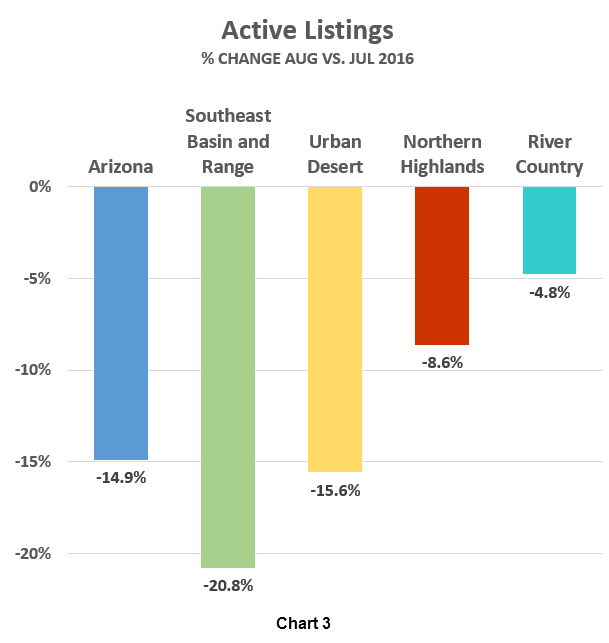
A few months ago, we asked: When are sellers going to start putting their homes on the market? The answer seems to be: Not yet! Active Listings in Arizona dropped nearly 15-percent in August, following July’s 14-percent decrease (Chart 3). Every region shows decreases in inventory.
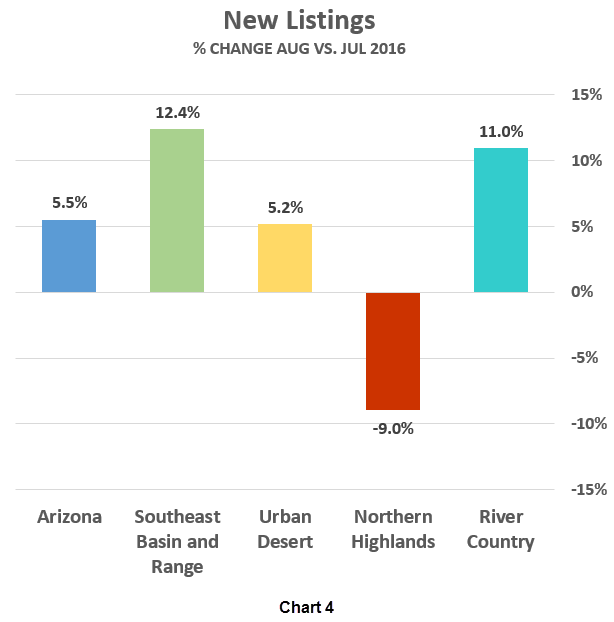
If there’s any good news about inventory, it is that New Listings have reversed their five month downward trend and have increased slightly over last month (Chart 4). The exception is in Northern Highlands, where demand is so high.
Prices Up Slightly Across Arizona – Introducing a New Metric
In the past, we’ve used Median Sales Price to compare changes in home values, but we’ve frequently noted that it doesn’t reflect how sales in upper or lower price ranges impact the indicator. This month, we change to *Average Sales Price Per Square Foot or simply “Price Per Square Foot.” There is no perfect metric for describing home values in very diverse real estate markets, but Price Per Square Foot gives us a better comparison, because sales of very large or very small homes have less influence on the average.
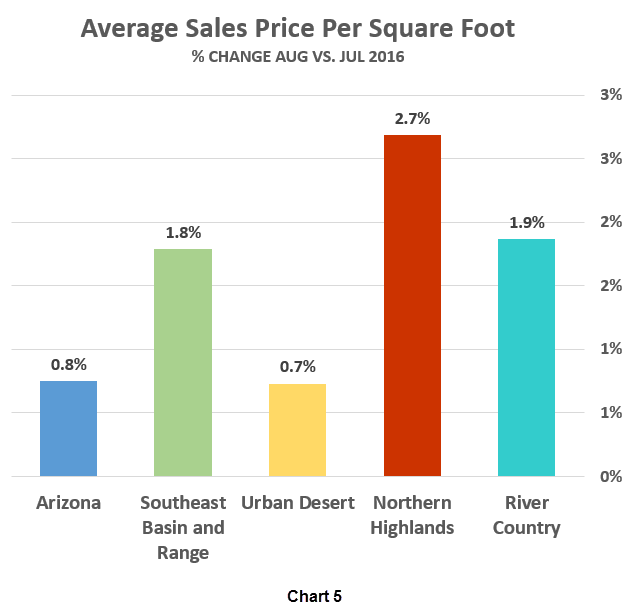
As you can see in Chart 5, values have increased slightly in every region over July. August 2016 prices are a little over 6-percent higher than August 2015. Strong sales combined with low inventories are not running up prices. This suggests that demand is stable and that the seller’s market is largely driven by low inventory. For comparison’s sake, below are the August figures for Price Per Square Foot.
| Arizona | (Overall) | |
| Northern Highlands | Flagstaff, Prescott, Sedona, Payson and White Mountains | |
| Urban Desert | Maricopa and Western Pinal Counties | |
| Southeast Basin and Range | Tucson and counties south and east of Pima | |
| River Country | Kingman, Bullhead City, Lake Havasu City and Yuma |
Summary
The Arizona real estate market hasn’t changed much in the last few months: sales are strong, inventories are low and prices about the same. We don’t talk much about new home sales, as only a small proportion of new homes appear on the MLS. New home sales in Arizona have been about 10 to 15-percent of the total units since 2009; according to the U.S. Census Bureau, construction permits are up over 10-percent compared with the first seven months of 2015. Increases in new home construction may begin to impact the market with more inventory and higher prices.
Note
These statistics are sourced from the REALTOR® Property Resource (RPR), which draws them directly from MLS systems across Arizona. In some cases, RPR reports its statistics differently from MLSs, which may occasionally result in dissimilar figures. For discussion purposes, the state of Arizona is divided into four distinct regions. While we could chose regions many different ways, these groupings work well in terms of climate, economies and terrain.
| Urban Desert | Maricopa and Western Pinal Counties | |
| Southeast Basin and Range | Tucson and counties south and east of Pima | |
| Northern Highlands | Flagstaff, Prescott, Sedona, Payson and White Mountains | |
| River Country | Kingman, Bullhead City, Lake Havasu City and Yuma |