The Valley Real Estate Market: Everything is Relative, Part 1 – Supply
Note: This article was updated 8/20/2014 with some revised text and figures.
This month’s look at ARMLS’s July STAT Report (http://www.armls.com/statistics/stat-library) shows little change from last month. Since the market is relatively unchanged, we are going to take the opportunity to go a little deeper into the statistics for a change. Individual statistics are like isolated pieces of a puzzle: they often don’t make much sense without the rest of the puzzle around them. The object of this month’s articles is to get you thinking about how market statistics fit together to make a complete picture.
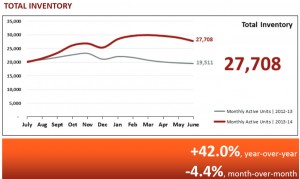
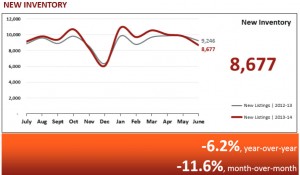
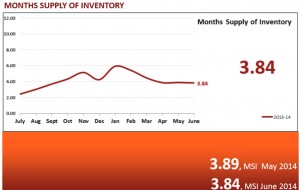
As you begin looking at the STAT Report, it is important to review several figures and try to find possible explanations—I call these “stories.” We will start by sifting through some stats related to market supply and look for our stories among the numbers. Some indicators of supply in the STAT report include Total Inventory, New Inventory and Months Supply of Inventory (MSI).
In June, Total Inventory is following the usual summer pattern and drifting lower, at 4% less than last month. With seasonal figures like inventory, it is important to look at the previous year figures, where we see there are over 8,000 more total listings than in 2013. While that is a significant (42%) increase year-over-year, in the context of historical totals, the overall inventory is about normal.
New Inventory is also decreasing: the number of new listings added to the inventory pool in June 2014 is slightly lower than last month and lower than a year ago. Make a note: both new and total inventory are edging downward.
Month’s Supply of Inventory (MSI) relates the overall inventory to the current rate of sales, so it also hints at demand. At 3.84, the MSI for June is about 45 days greater than a year ago. Something must have been different last year at this time. Does it have to do with the increase in inventory from last year?
Now we start looking for stories by asking questions. If new listings are coming in at about the same rate as last year, yet overall listings are higher than last year, what explains the increase? For one thing, higher MSI suggests that listings are staying on the system for a longer time. Another possibility is that sales volume is down. Is that happening? We’ll see when we look at demand.
Here are some comments you might convey to your clients about supply in this market:
• Supply is good. Inventory is about normal and offers buyers more choices than they had in 2013. Sellers have a lot more competition than this time last year.
• A more “normal” MSI is around three months, so we currently have about 10-15 days more supply than ideal. That is not a lot, but probably indicates something is different with demand.
Tags: market analysis

