The Valley Real Estate Market: Everything is Relative, Part 3 – Prices
Note: This article was updated 8/20/2014 with revised text and figures.
Last, but not least, the final element is pricing, which can help validate our earlier conclusions or lead us to new ones. The STAT indicators to examine for pricing clues all have “price” in their names: Sales Prices, New List Prices and ARMLS’s Sales Price Forecast.
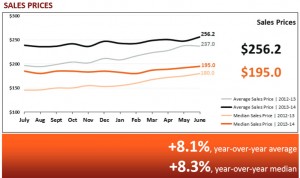
A brief glance at the three thumbnail charts below will tell you that nothing much exciting is happening with prices. Pretty flat and boring, right? However, “boring” actually tells us a great deal. First, a quick note about average price versus median price. Both are useful measures of market price central points, but I prefer to use median prices as they tend to be less affected by extreme highs or lows at the opposite ends of the market.
The Sales Prices chart shows that the median price (orange figures in the graph) of homes closed in June has increased 8% year over year. Depending on who you consult, annual, long term increases in home prices have been 3-4%. While somewhat flat, actual sales prices seem to be increasing at a rate near historical averages.
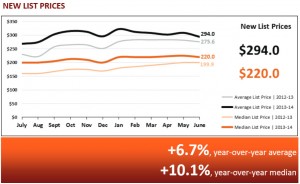
New List Prices indicate what sellers hope to get for their properties. The percentage increases from last year are interesting, but more revealing is the difference between what sellers are asking in June of 2014 ($220,000) compared to what homes actually sold for ($195,000). More about that later.
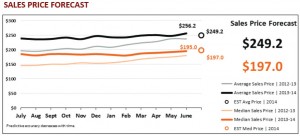
ARMLS’s Sales Price Forecast is a unique combination of several figures to arrive at a forecast of where prices are going. Predicted for July, median price forecast is slightly higher, while average price is slightly lower. This suggest we may see some price decreases at the extreme upper end of the market.
Here are some comments you can convey to your clients about the current Phoenix area market:
• Prices have not shown much volatility in recent times. After the market recovery in 2011 and 2012, prices have been relatively stable for the last year. Since prices appear to align with trend lines plotted over the past 50 years, it is reasonable to expect modest price increases to continue. Keep your eye on the Sales Price Forecast for next month, though.
• The June Sales Prices median is $195,000 while the New List Prices median is $220,000. Call New List Prices “hope” and Sales Prices “reality.” It looks like sellers are still fondly remembering the market bubble in the mid-2000s and are hoping for higher prices.
• To their credit, slower demand isn’t panicking sellers into dropping asking prices. They realize their properties were undervalued after the bubble and are holding out for reasonable prices.
• The reality of current Sales Prices is validated by the Sales Price Forecast which is very close to June’s prices. ARMLS isn’t expecting any rapid, near-term price increases or decreases.
After looking at supply, demand and pricing, we can conclude that the combination of increased supply, lower demand, stable prices and overall steadiness of the market suggests that neither sellers nor buyers are in any hurry to change their behavior. Buyers have a slight edge, but not enough to get sellers to lower their asking prices.
This wraps up our look at June Valley statistics, as provided in ARMLS’s excellent monthly STAT Report. You should be in a better position now to read the numbers and make your own judgments about whichever market you are in. There are no absolute answers, just different conclusions. Please share your comments about this article and email me your ideas about other topics to discuss. I’m Ron LaMee, ronlamee@aaronline.com.
Tags: market overview

