Arizona Residential Real Estate Market Report – June 2016
This is a snapshot of four different regions of the Arizona real estate market for June 2016. For more about how these segments are divided, please see the note at the end of this article.
Quick Takeaways – Real Estate Across Arizona
- We’re in a marginally stronger seller’s market; we are still waiting for a seasonal drop-off in sales which could move the needle back toward a neutral market
- Sales are still strong, demand is high and inventories shrinking; median home prices are slightly ahead of last month
- This month we look at the seasonality of sales figures for two very distinctive regions in our state and explore the question, “Is there a bubble?”
Another Increase in Sales, But Smaller Than Last Month – Northern Highlands Leads Again
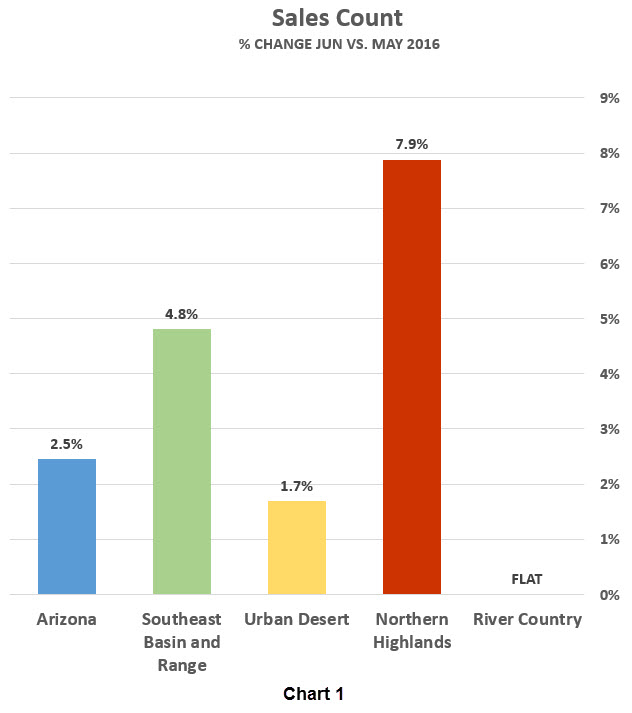
Looking back, May’s Sales Count was fairly flat, perhaps up just a little statewide. June is essentially the same, including another big increase in the Northern Highlands (Chart 1). The River Country is the only area with no growth in sales. Let’s see if we can find an explanation for these trends in these two regions.
Summer months in Arizona tend to herald slowdowns in sales activity and we know that the Northern Highlands feature the mildest seasonal temperatures, while the River Country experiences some of the warmest in the state. Do warm temperatures explain the difference in sales trends? Let’s compare the first six months of 2015 and 2016 for each region (Charts 2a and 2b).
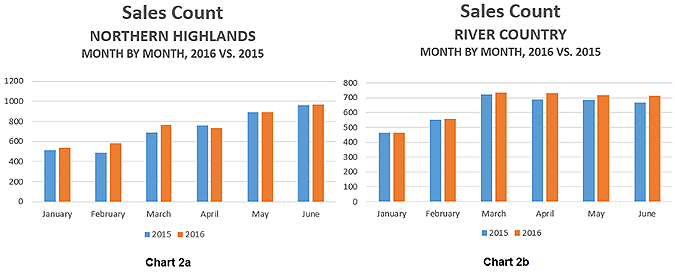
While it appeared that the Northern Highlands have been experiencing somewhat of a “boom” lately, Chart 2a suggests it is largely a seasonal boom which also occurred in 2015 as well. Overall, Northern Highlands’ 2016 sales are slightly ahead of 2015.
For the River Country, what looked like a sag in sales was really a seasonal adjustment. In fact, early summer sales in River Country are not only ahead of last years, but they are holding on longer this year. Comparing these charts side-by-side provides an illuminating view of how diverse real estate markets are in Arizona. Both regions are having good years, but in the cooler Northern Highlands, sales activity starts later and is still increasing. In our warmer River Country, sales build faster and peak earlier.
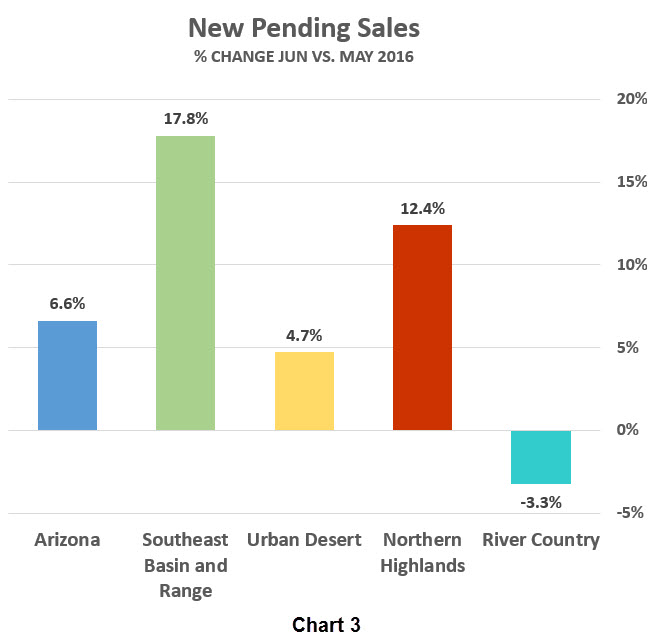
Next, we look at June’s New Pending Sales (the rate at which buyers are signing contracts) for some insight into what to expect in July. To recap, sales growth has been steady this spring, fueled by monthly increases in New Pending Sales. In June, Chart 3 shows New Pending Sales have increased again, but at a slightly slower pace, perhaps signaling a tapering of sales. The exception to this growth is in the River Country, which (as just discussed) is beginning its seasonal drop-off and a decrease is right in line with expectations.
Stable Demand + Decreasing Inventories = Stronger Seller’s Market
Tighter inventories across Arizona don’t seem to be keeping buyers away. To get a sense of this, figures show that in all of Arizona some 10,500 additional home contracts were signed in January of this year. Since then, an average of just over 13,900 more contracts have been signed each month, culminating with 16,100 contracts signed in June. Demand has indeed been stable.
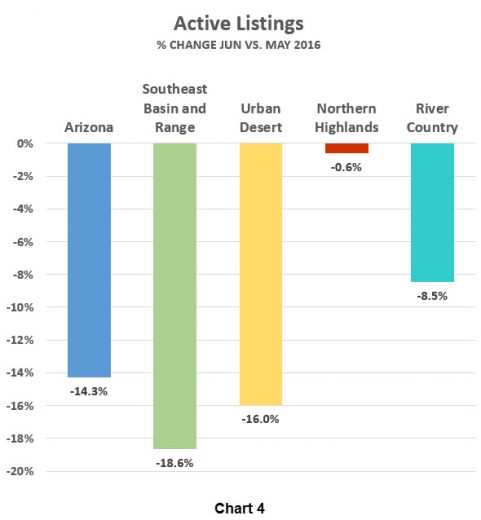
However, the number of sellers putting their homes on the market each month is decreasing, leading to lower inventories in every region (Chart 4).
The seller’s market gained a little strength in June, but buyers still have choices in most price ranges. In this environment, savvy agents will be counseling their buyers:
- Be very clear about what you’re looking for in a home; prioritize your needs and when the right number of needs are met, make an offer!
- Avoid lowball offers; unless a home clearly has problems, lowball offers at best risk being ignored and at worst will antagonize a seller.
- Know your competition when buying a home in any sort of market…a REALTOR® can help.
At the same time, savvy agents will be telling their sellers:
- Sellers may have the edge in this market, but the greater market is made up of micro-markets defined by location, square-footage, amenities, etc.; what the people down the street sold for is an indication, not a benchmark for your home’s value.
- Your home may sell fairly quickly; you need to be flexible in showing your home and have a game plan for your next home.
- Your home is a product and you need to know your competition…a REALTOR® can help.
Prices Continue Upward Trend
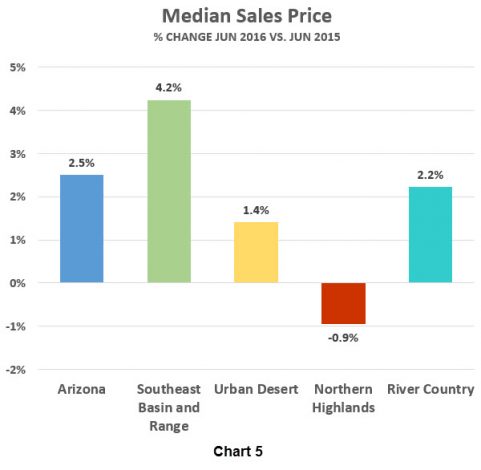
Once again, June’s statewide Median Sales Price inches a little higher from the previous month. Chart 5 below shows that prices are up slightly from this time last year as well, except in the Northern Highlands. This is most likely due to their experiencing greater activity in more modest price ranges than last year, which tends to draw down median prices.
Is There a Bubble?
I’m not an economist, but I can work the numbers. In mid-2006, the median home price in the Urban Desert hit its peak at $265,000. Five years later, it hit the bottom at $108,000. Currently it’s $227,000, right at the median price for all of Arizona. If you grew the pre-Recession average median price of $160,000 at half a percent per year, today’s median would be $100,000 higher than its current $220,000.
It’s true that lending policies and government regulations impact market dynamics, but my sense is that modest price increases in the face of strong demand and low inventory is the best indicator that we are not facing an overheated housing market in Arizona.
Note
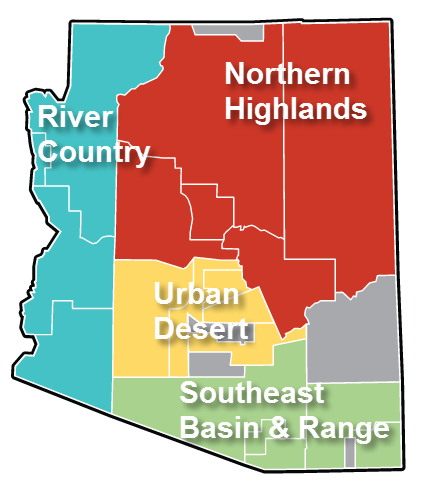
These statistics are sourced from the REALTOR® Property Resource (RPR), which draws them directly from MLS systems across Arizona. In some cases, RPR reports its statistics differently from MLSs, which may occasionally result in dissimilar figures. For discussion purposes, the state of Arizona is divided into four distinct regions. While we could chose regions many different ways, these groupings work well in terms of climate, economies and terrain.
| Urban Desert | Maricopa and Western Pinal Counties | |
| Southeast Basin and Range | Tucson and counties south and east of Pima | |
| Northern Highlands | Flagstaff, Prescott, Sedona, Payson and White Mountains | |
| River Country | Kingman, Bullhead City, Lake Havasu City and Yuma |
Related story: Bubble Watch: Could the Housing Markets in These Top Cities Be Getting Too Hot? Tags: active listings, arizona, Market, market report, median sales price, new pending sales, Northern Highlands, residential real estate, River Country, sales count, Southeast Basin and Range, Urban Desert