Arizona Residential Real Estate Market Report – April 2016
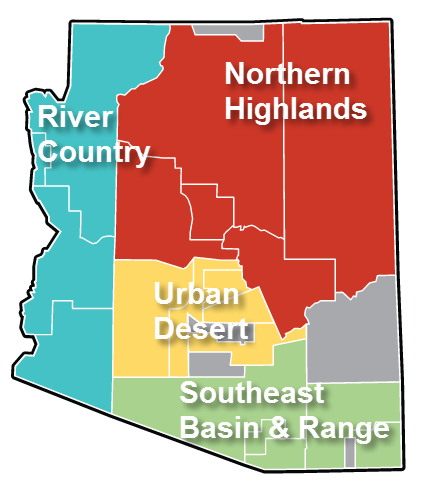
This is a snapshot of four different regions of the Arizona real estate market for April 2016. For more about how these segments are divided, please see the note at the end of this article.
Quick Takeaways – Real Estate Across Arizona
April’s sales maintained March’s strong pace and are ahead of 2015’s pace. Pending Sales predict that sales will remain healthy in May. This, along with the fact that inventories are shrinking in most areas of the state, indicates that our seller’s market is gaining momentum.
Median prices are up slightly from a year ago, except in the Northern Highlands, where good inventories are still available. The White Mountains, Payson/Pine, Prescott and Flagstaff are looking very appealing!
Sales Same Level as March 2016, Yet Higher Than 2015
While Sales levels this month are flat, the good news is that Arizona markets remain at the highest level in two years (Chart 1). Since every area in the state enjoyed massive gains in March, it’s reasonable to expect some flattening as is happening in April.
As we’ve noted in an earlier report, Sales Count started its annual climb a bit earlier this year and is maintaining pace. Compared with a year ago, the Southeast Basin and Range area leads the way with a 10% increase in 2016 over 2015 with the Urban Desert and River Country areas showing smaller gains. Sales in the Northern Highlands decreased slightly.
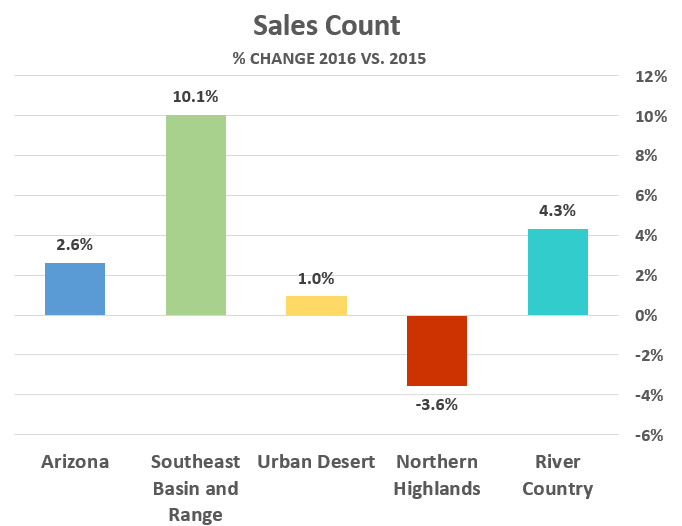 Chart 1
We continue to watch Pending Sales closely, as this figure is an excellent predictor of whether spring sales numbers have reached a market peak, or if the market is simply catching its breath before further increases.
Also note that Pending Sales in April increased statewide by an additional 17% over March. To put this in perspective, the 16,100 Pending Sales in April 2016 is more than 30% higher than April 2015, which was a decent year for Arizona real estate markets.
Looking at Pending Sales across the state (Chart 2), we can expect sales levels to maintain in May, if not actually increase in every area. The Southeast Basin and Range leads the way with a 40% increase over March’s 50% increase. The markets in Tucson and southeastern Arizona are heating up!
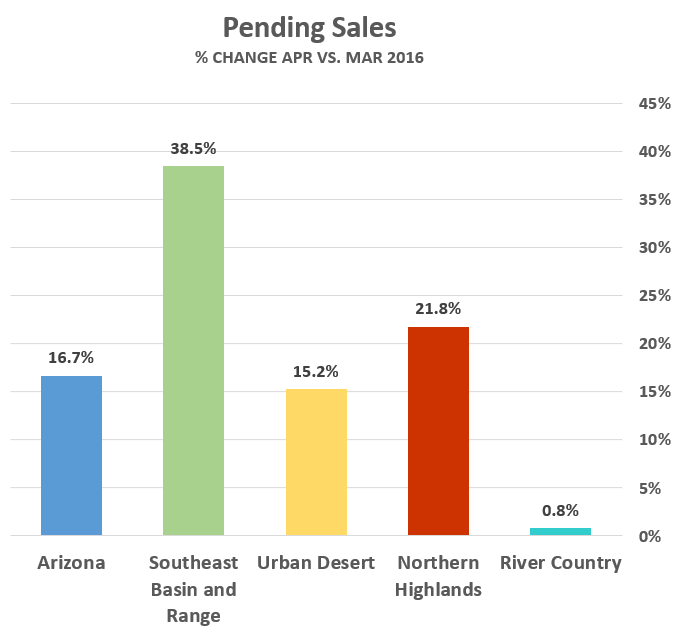 Chart 2
Inventories Lower, New Listings Losing Pace
The same question is being echoed around the country: What is keeping sellers at home? Chart 3 below indicates that the rate of New Listings flowing into housing inventories is shrinking in every area of the state, except the Northern Highlands. While New Listings are still a bit higher than a year ago, strong sales means only one thing: less inventory for buyers to choose from.
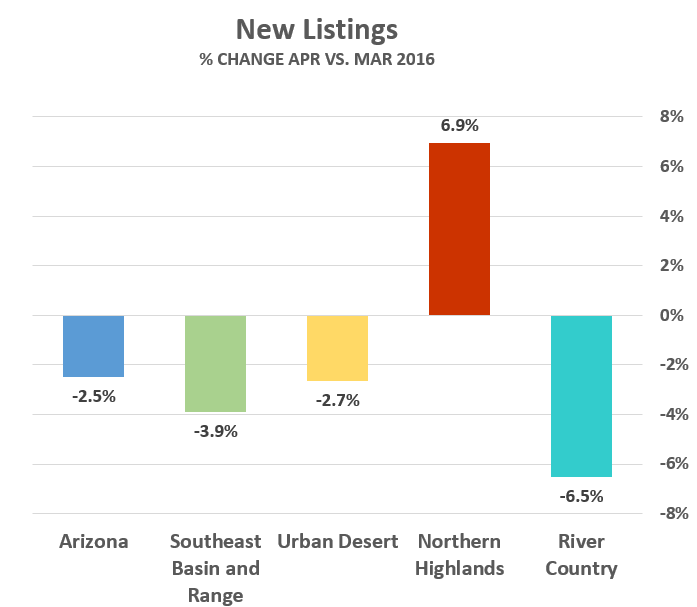 Chart 3
Overall housing inventories in Arizona dropped 5% in April, following drops of 8.5% in March and 4.4% in February (see Chart 4). In most areas of the state, we are in a strengthening seller’s market. With decreasing inventories, buyers are finding it more difficult to find their perfect home and may have to out-bid other buyers.
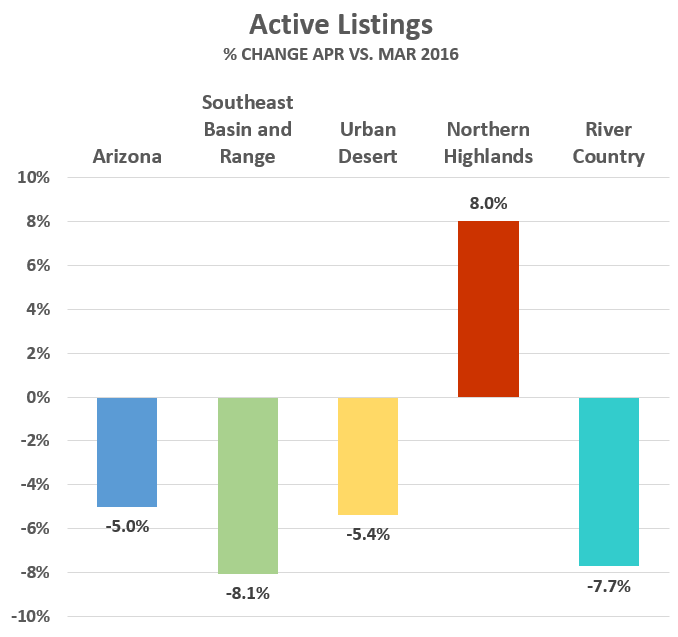 Chart 4
Returning to the question we opened this section with, what is keeping sellers from listing their homes? A REALTOR® Magazine article suggests that trade-up sellers often look for a new home before they list and they are having problems finding that home within their price range.
To validate this, we examined Cromford Report data for our largest market (Urban Desert, representing Maricopa and western Pinal counties) and found that Months of Supply in prices between $200,000-$400,000 range from 2 to 3 ½ months, compared with 6 months in the price ranges from $400,00 to $600,000—there isn’t as much inventory to choose from in moderately-priced homes and there is plenty of competition.
Note that the median home price in the Urban Desert area is a little over $270K. Paradoxically, we need an increase in inventory in the right price ranges before sellers have confidence to put their homes on the market.
Home Prices Continue to Rise
Median home prices in Arizona increased another 2.5% in April, following March’s 2.5% rise—another indication of a strengthening seller’s market. Chart 5 indicates a 2.5% gain in statewide Median Sales Prices from 2015 to approximately $210,000 in 2016.
The best bargains seem to be in the Northern Highlands, where prices are essentially flat year-over-year. Favorable prices are likely due to the healthy inventory in this area (see Charts 3 and 4 above).
If you’re looking at 110+ degree temperatures…as we are in the Arizona REALTORS®’ headquarters in Phoenix…it’s time to go shopping for a summer home in the beautiful mountains!
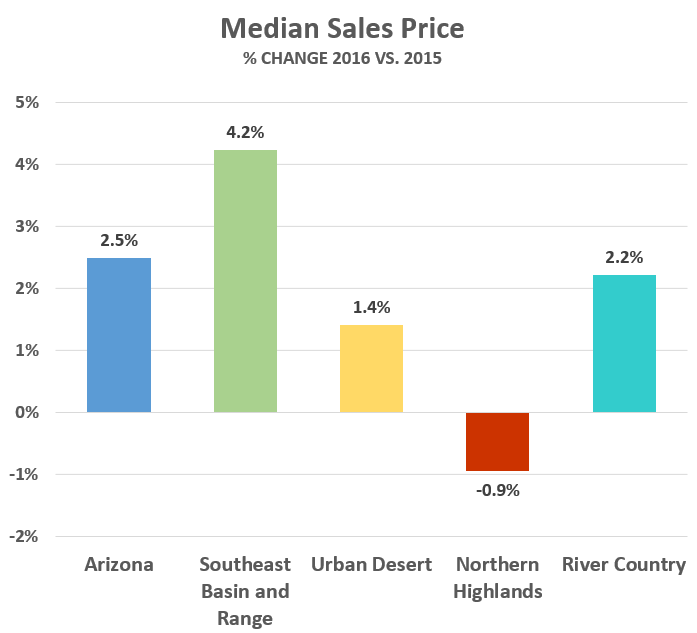 Chart 5
Note
These statistics are sourced from the REALTOR® Property Resource (RPR), which draws them directly from MLS systems across Arizona. In some cases, RPR reports its statistics differently from MLSs, which may occasionally result in dissimilar figures. For discussion purposes, the state of Arizona is divided into four distinct regions. While we could chose regions many different ways, these groupings work well in terms of climate, economies and terrain.
| Urban Desert | Maricopa and western Pinal counties | |
| Southeast Basin and Range | Tucson and counties south and east of Pima | |
| Northern Highlands | Flagstaff, Prescott, Sedona, Payson and White Mountains | |
| River Country | Kingman, Bullhead City, Lake Havasu City and Yuma |